Results
Comparative Stats
This section presents a cross-city comparison of bus stop density and walk-based accessibility indicators. While the underlying methods are consistent across all cities, interpretation must consider each city’s unique transit system design, land-use context, and service philosophy.
1. Bus stop density
Interpretation
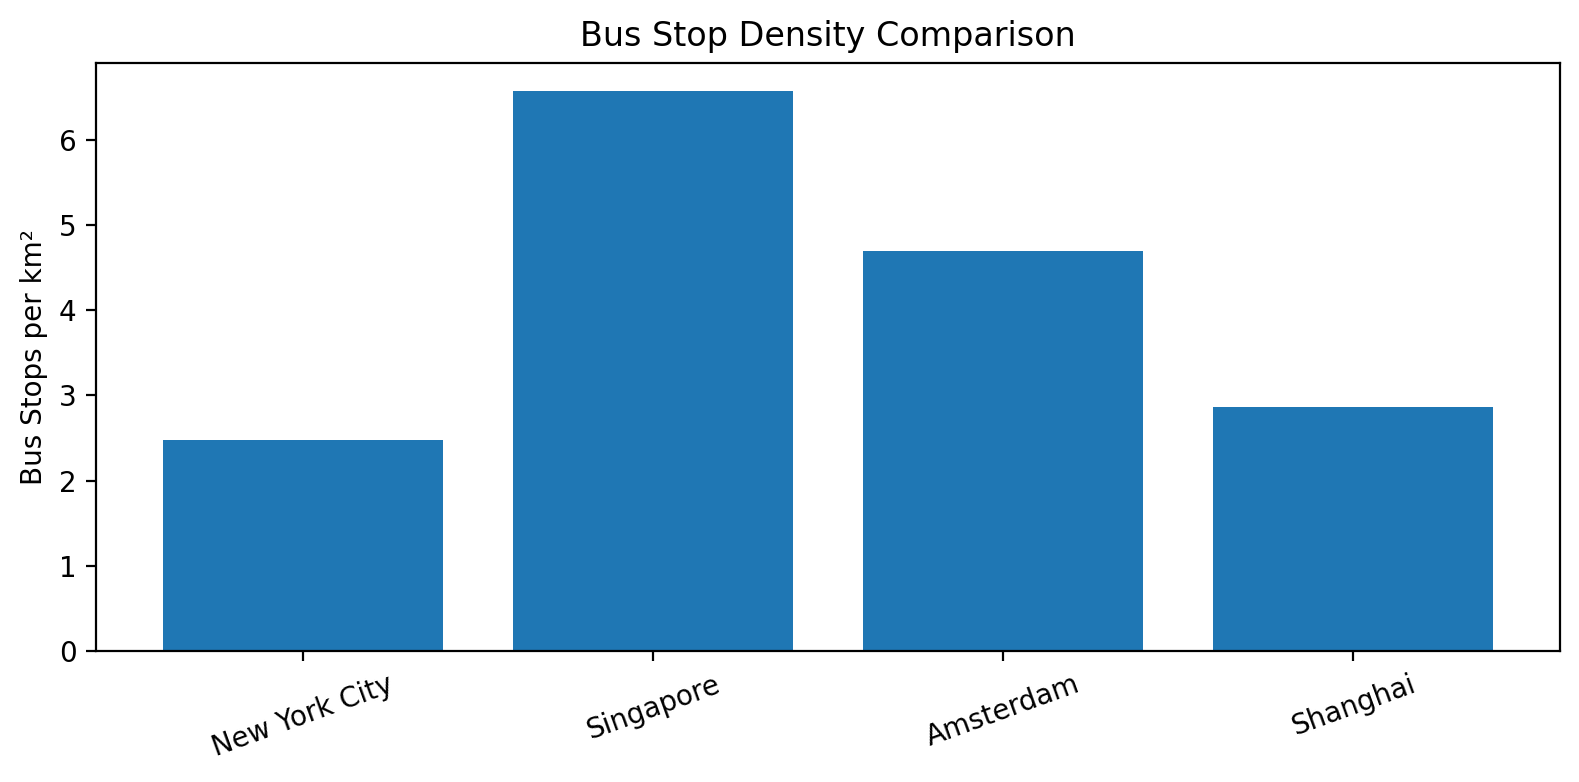
The four cities show substantial variation in bus stop density:
Singapore (6.58 stops/km²)
Exhibits the highest density, consistent with a fully planned bus system designed to provide short and regular walking access island-wide.Amsterdam (4.7 stops/km²)
Dense stop pattern supported by its compact form and the interplay of buses, trams and metro within the historical core.Shanghai (2.87 stops/km²)
The number understates the density of the built-up urban core because the municipal boundary includes very large peripheral, industrial and rural areas.New York City (2.48 stops/km²)
The lowest of the four cities, reflecting the bus network’s role as a secondary mode alongside an extensive subway system.
Key takeaway
Density reflects urban form and planning philosophy, not just network size:
- Strong central planning → very high density (Singapore)
- Compact historic city → medium–high density (Amsterdam)
- Huge administrative territory → diluted density (Shanghai)
- Subway-dominant transit → lower bus density (NYC)
2. Density summary table
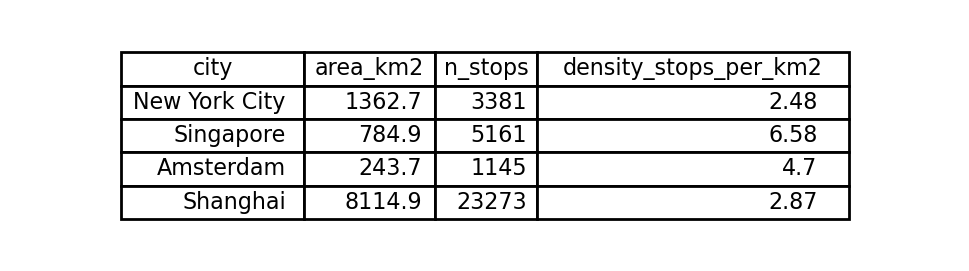
The table highlights the interaction between land area and stop counts. Most notably, Shanghai’s density is moderate, but only because its administrative area is exceptionally large.
3. Detailed accessibility indicators
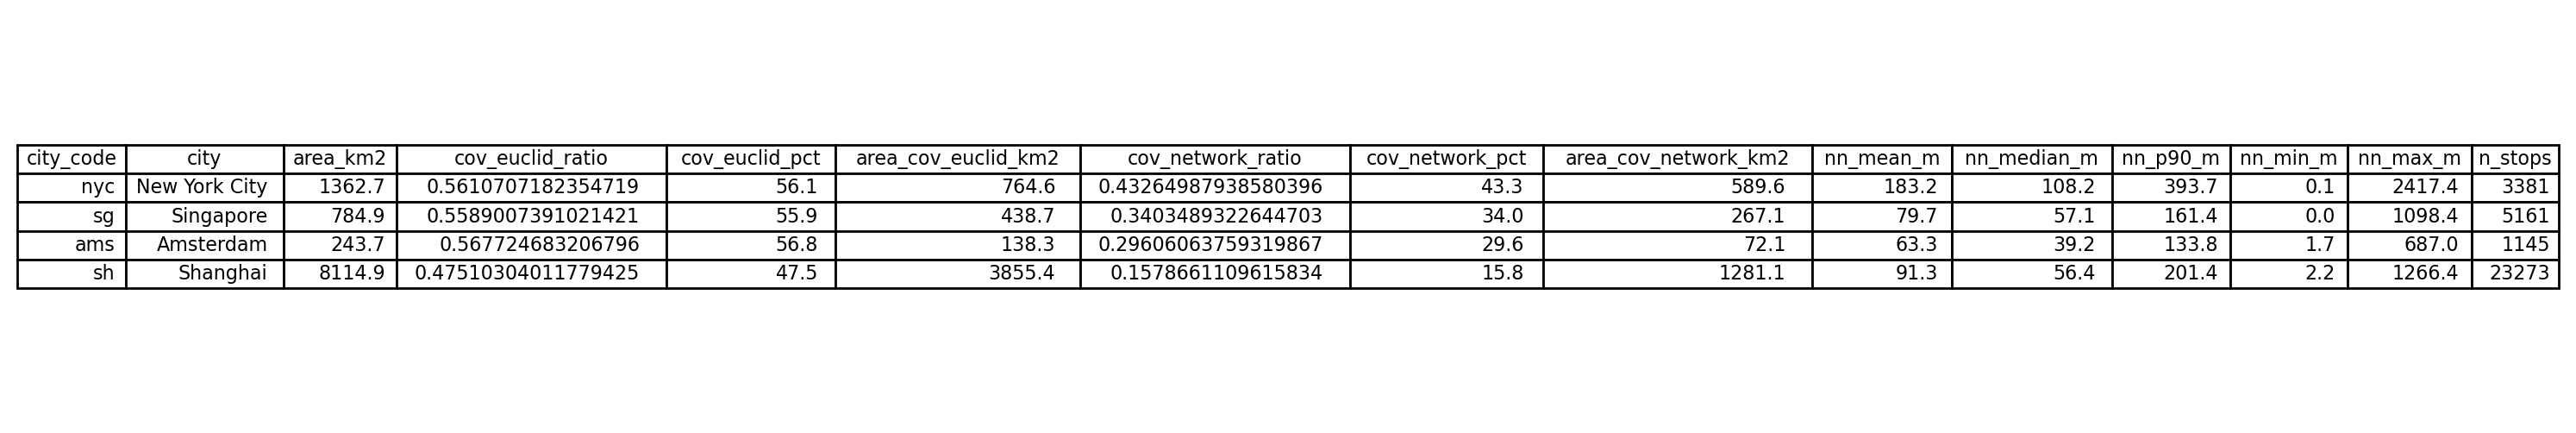
This table reports Euclidean and network-based 500 m coverage, covered area, and nearest-neighbour distance statistics.
A. 500 m Euclidean coverage (≈47–57%)
Contrary to earlier expectations, the Euclidean 500 m coverage values are not uniform across cities:
| City | Euclidean Coverage | Interpretation |
|---|---|---|
| Amsterdam (56.8%) | Highest—compact area and dense core coverage. | |
| NYC (56.1%) | Surprisingly high despite low density; reflects concentrated built-up areas and long bus corridors. | |
| Singapore (55.9%) | Consistently accessible network resulting from systematic stop spacing. | |
| Shanghai (47.5%) | Lower than the others, because the municipal boundary includes vast low-density tracts where no coverage is intended. |
Why Shanghai’s value is lower now
- The boundary used in the analysis is much larger than the functional city.
- Even with dense stop spacing in Puxi/Pudong, the outer districts dilute the ratio.
- This does not indicate worse accessibility within the inhabited urban core.
B. Network-based 500 m walking coverage (≈16–43%)
The network-based coverage metric—unlike Euclidean buffers—follows actual walkable streets. It therefore produces much smaller values, which is expected.
| City | Network Coverage | Interpretation |
|---|---|---|
| NYC (43.3%) | Highest, due to extensive walkable street grids and long interconnected bus corridors. | |
| Singapore (34.0%) | Regular street layout produces balanced accessibility but limited by natural barriers and expressways. | |
| Amsterdam (29.6%) | Compact organic street pattern creates excellent local accessibility but reduces reachable land area at 500 m when measured over the full municipal extent. | |
| Shanghai (15.8%) | Lowest, again driven by the scale of the boundary—outer districts contain large areas with sparse streets or non-residential land. |
Why network coverage < Euclidean coverage
A 500-m circle overestimates walkable distance;
a 500-m network buffer reflects:
- barriers (rivers, rail lines, highways),
- cul-de-sac layouts,
- differences in street connectivity.
Thus, network coverage is more realistic.
C. Nearest-neighbour distances
| City | Mean NN Dist | Interpretation |
|---|---|---|
| Amsterdam (63 m) | Dense mesh of stops and tram corridors. | |
| Singapore (79 m) | Regular spacing aligned with planning guidelines. | |
| Shanghai (91 m) | Tight spacing in urban core, wider gaps in peri-urban districts. | |
| NYC (183 m) | Widest spacing due to long blocks and subway-oriented network function. |
The distribution shape (min–max and 90th percentile) confirms:
- NYC has the greatest spatial inequality in stop spacing.
- Amsterdam/Singapore have consistent, predictable spacing.
- Shanghai mixes highly dense urban cores with much sparser outer districts.
4. Cross-city insights
1. Density does not directly predict coverage
Although Singapore has more than double Amsterdam’s density, their
Euclidean coverage is nearly identical (≈56%).
The distribution of stops matters more than the count.
2. Network-based coverage reveals true accessibility
Coverage drops sharply (e.g., Amsterdam 56.8% → 29.6%) when walking barriers are considered, showing that Euclidean buffers systematically overestimate accessibility.
3. Administrative boundaries heavily influence results
Shanghai’s lower coverage (Euclidean and network) is due to the inclusion of vast non-urban areas.
Within the actual built-up city, coverage is much higher.
4. Nearest-neighbour spacing is the best indicator of street-level accessibility
It captures walkability and network structure far more effectively than density.