Global Bus Accessibility Analysis
Background and Motivation
Public transport accessibility is a central concern in contemporary urban planning. A dense and well-distributed bus network can reduce car dependence, support social equity, and connect residents to jobs, education, and essential services. At the same time, many large cities worldwide are facing pressures from rapid urbanisation, climate change, and increasing socio-spatial inequality. Understanding where bus services are abundant – and where gaps remain – is therefore both a technical and a normative question.
This project investigates bus stop accessibility in four major metropolitan areas:
- New York City (USA)
- Singapore
- Amsterdam (Netherlands)
- Shanghai (China)
Together, these cities span different continents, governance regimes, urban forms, and data environments. Comparing them side by side allows us to see how different planning traditions and data infrastructures are reflected in the spatial patterns of bus service.
Why These Four Cities?
City Bus Systems in Context
Although this project focuses on bus stop locations rather than service operations, it is important to understand the broader context of each city’s bus system. The brief profiles below summarise key features that inform the interpretation of the spatial patterns.
New York City
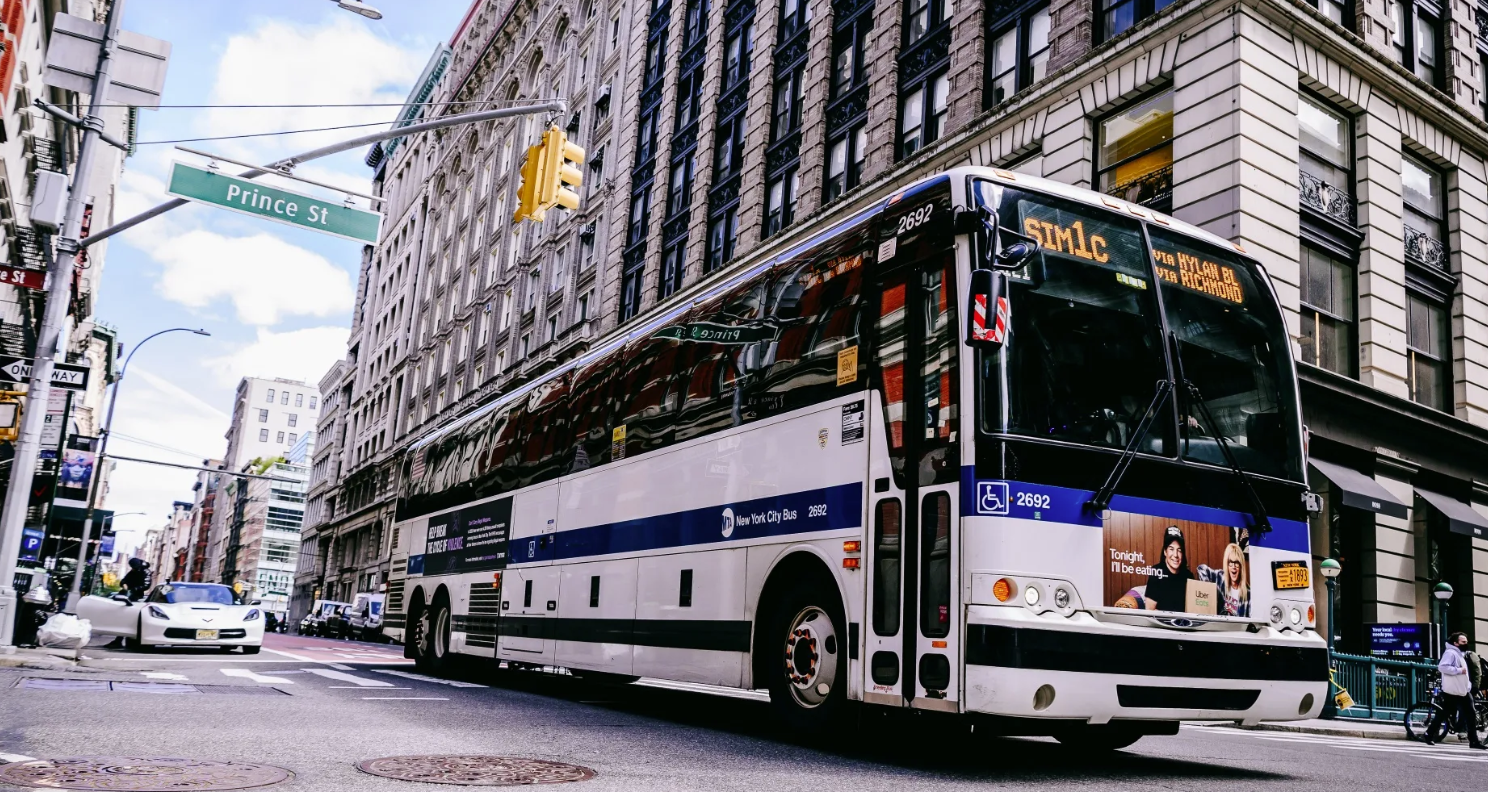
Image source: Bloomberg – Free NYC buses complicated by bond-paying pledge
New York City’s bus network is operated under MTA Regional Bus Operations (RBO), which consolidates services provided by MTA New York City Bus and MTA Bus Company. Together they form one of the largest bus systems in the world, with a fleet of over 5,000 vehicles, more than 300 routes, and many services operating 24/7. The network includes local stopping routes, limited-stop and express lines, as well as Select Bus Service corridors that approximate bus rapid transit. Historically separate operating companies – including several private operators in Queens and express services from the outer boroughs – have gradually been integrated into a unified fare and scheduling system. As a result, the spatial footprint of bus stops reflects both legacy private franchises and later rationalisation efforts by the MTA.
Singapore
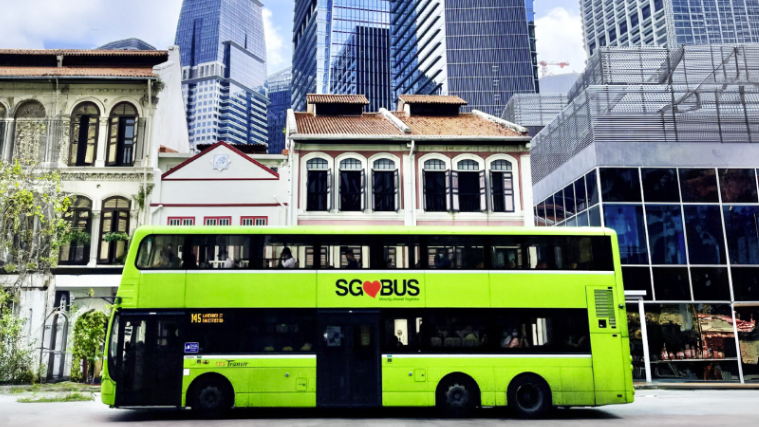
Image source: Trapeze Group – Bus services in Singapore
Singapore’s bus system is highly structured and formally categorised. Routes are differentiated into trunk services linking major towns, feeder services circulating within neighbourhoods, express and peak-hour routes that skip lower-demand stops, short-trip variants of longer lines, special industrial services to Jurong and Tuas, cross-border services to Malaysia, and a range of niche services such as Resorts World Sentosa shuttles and privately operated “Scheme B” routes. Under the Bus Contracting Model, services are organised into packages and competitively tendered to different operators, while the Land Transport Authority plans the overall network. This institutional set-up tends to produce relatively systematic spacing of stops and strong coordination between buses and the MRT network.
Amsterdam
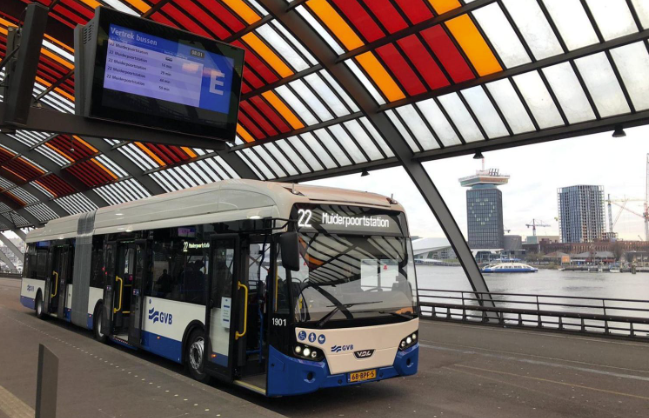
Image source: GVB Amsterdam takes the first step with battery-electric buses
In Amsterdam, buses complement an already dense tram and metro system. Within the municipality, city buses are mainly operated by GVB and serve outer neighbourhoods and corridors that are not covered by tram or metro. Regional bus companies such as Connexxion, EBS, and Transdev connect Amsterdam with surrounding towns and key visitor destinations in the wider region (for example the Waterland villages, Zaanse Schans, and Schiphol Airport). For visitors and commuters, the Amsterdam & Region Travel Ticket provides integrated access to these services across operators. The result is a bus stop pattern that is strongly shaped by inter-operator coordination and the presence of multiple overlapping modes.
Shanghai
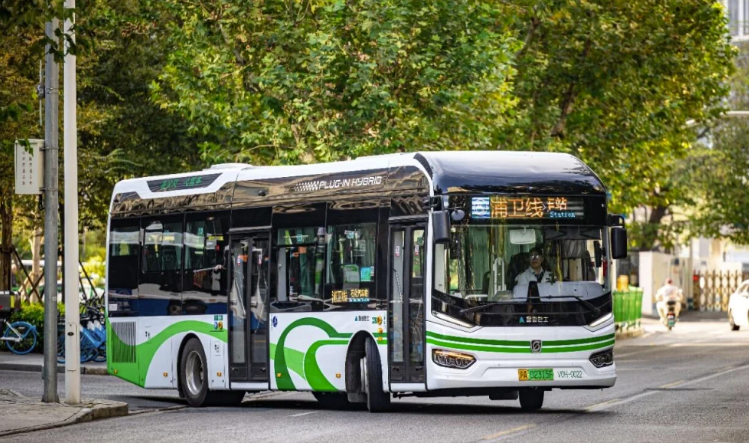
Image source: The China Journey – Shanghai travel guide
Shanghai’s bus network is large, multi-operator, and highly differentiated. More than ten bus companies operate roughly 1,600 routes that link the dense central districts with rapidly expanding suburban areas. Regular urban lines are numbered (roughly from 1 to the 900s), while additional labels distinguish cross-river and tunnel services, district and suburban routes, night buses, peak-hour express lines, and local shuttle services designed to solve the “last-kilometre” connection to metro stations and between major roads and residential communities. On most inner-city routes, stop announcements are made in Mandarin, Shanghainese, and English, reflecting the city’s multilingual context. This complex operational structure contributes to a very dense but spatially heterogeneous pattern of bus stops.
The cities were selected for three main reasons:
Diverse planning and transit models
- New York City represents a large, polycentric North American metropolis with a long history of high-capacity transit (subway, commuter rail) and a dense but uneven bus network.
- Singapore is a compact city-state with a strongly integrated public transport system, where bus routes are carefully coordinated with the MRT network and land-use planning.
- Amsterdam exemplifies a European approach to sustainable mobility, with a combination of rail, tram, bus, and high levels of walking and cycling.
- Shanghai is a rapidly developed megacity where metro expansion and bus network restructuring have taken place at remarkable speed over the last two decades.
These contrasting contexts offer a natural laboratory for exploring how bus stop patterns emerge under different planning paradigms.
- New York City represents a large, polycentric North American metropolis with a long history of high-capacity transit (subway, commuter rail) and a dense but uneven bus network.
Variation in open data and data sources
The four cities also differ in how transit and boundary data are made available:
- New York City and Singapore provide rich, curated datasets via open data portals.
- Amsterdam publishes detailed administrative boundaries, while bus stops are obtained from OpenStreetMap.
- Shanghai lacks comprehensive official open transit data, so OpenStreetMap, via the Overpass API, is used as the main bus stop source, and Simplemaps is used for municipal boundaries.
This mix reflects the reality that urban researchers often rely on a combination of official and volunteered geographic information (VGI).
- New York City and Singapore provide rich, curated datasets via open data portals.
Comparability as large global cities
All four are large, economically significant cities with extensive public transport systems and substantial daily ridership. Comparing bus stop accessibility across them therefore speaks to broader questions about global urban mobility and spatial justice, rather than to small idiosyncratic cases.
Research Questions and Objectives
The analysis is guided by four main questions:
- How dense are bus stop networks in each city?
- What share of the urban area lies within a walkable distance (500 m) of a bus stop?
- How are bus stops spatially distributed – clustered, even, or irregular – as reflected in kernel density surfaces and nearest-neighbour distances?
- How might differences in planning approaches and data environments help explain the observed patterns?
The objectives are:
- To construct a transparent and reproducible geospatial workflow for analysing bus accessibility using open-source Python tools.
- To produce comparable indicators of bus stop density, walking coverage, and spatial regularity across the four cities.
- To generate maps and summary statistics that can support discussions on transit equity, network design, and the role of open data in urban research.
Relation to Urban Planning and Policy
Although this is a data-driven exercise, the questions are rooted in urban planning debates:
- Equity and inclusion – who benefits from high levels of bus service, and which neighbourhoods remain underserved?
- Multimodal integration – how do bus stop patterns complement or duplicate rail and metro networks?
- Street and land-use structure – how do built form and road layout shape feasible bus routing and stop spacing?
- Data and governance – how do different open data practices facilitate or constrain comparative research?
The results should be read not as a definitive performance ranking of cities, but as a spatial diagnostic that helps planners and researchers ask better questions about transit provision and access.
How to Use This Website
- The Methods page describes the data sources and geospatial methods in more detail.
- The Results page summarises cross-city comparisons of density, coverage, and spatial statistics.
- The Cities menu provides dedicated pages for New York City, Singapore, Amsterdam, and Shanghai, including maps and interpretive comments.
- The Data Sources page documents boundary and bus stop datasets and highlights limitations.
- The About page introduces the author and situates the project in a broader academic context.