1. Bus stops and boundary
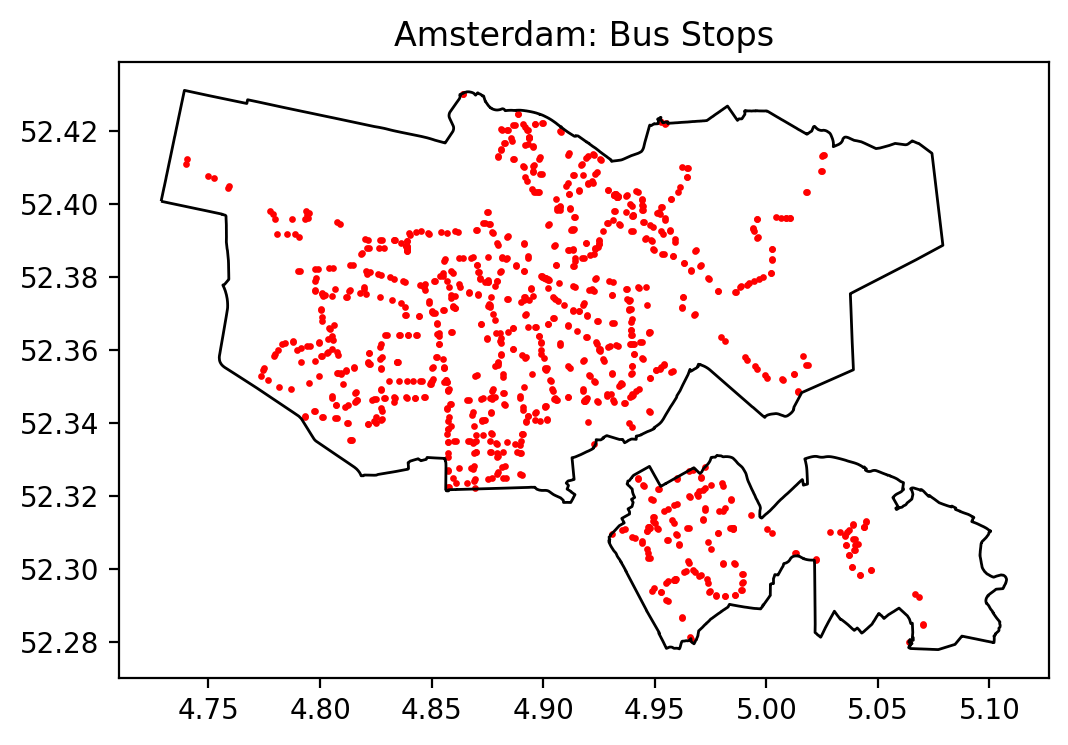
Amsterdam’s bus stops are concentrated heavily in the central urban districts (Centrum, West, Zuid, Oost), with an additional secondary cluster around Amstelveen in the south. This produces a “multi-core + strip-like” distribution pattern aligned closely with the city’s spatial structure:
- Historic centre (Centrum) has dense, irregular street networks, resulting in tightly packed bus stop clusters.
- Expansion districts (Zuid, West, Nieuw-West) show more grid-like patterns, reflected in more regular stop spacing.
- Amstelveen serves as a major suburban residential and commercial node, forming the second dense cluster.
Compared with New York, Amsterdam lacks an ultra-dense corridor analogous to Manhattan, and instead resembles Singapore’s multi-nodal structure—although overall density is significantly lower due to different urban form and population patterns.
2. 500 m coverage
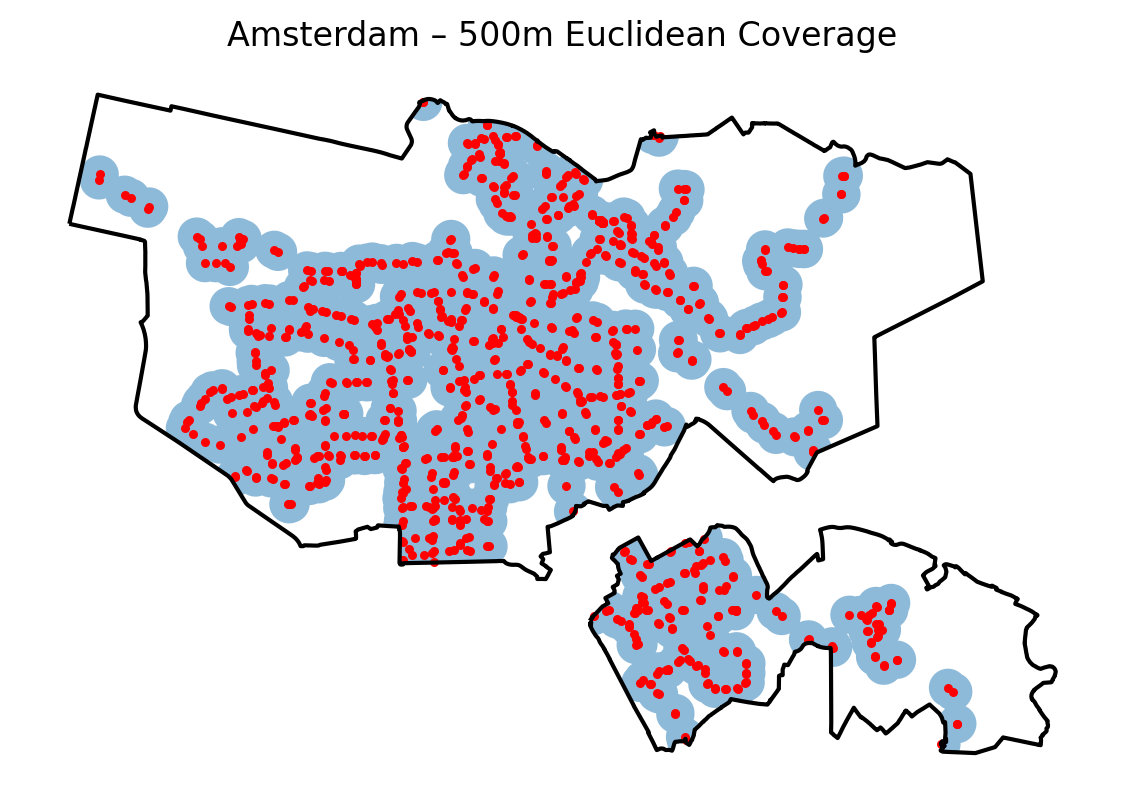
The 500 m (5–7 minute walking distance) coverage analysis shows:
- Almost complete coverage across the city centre and Amstelveen, forming continuous blue buffers.
- Coverage becomes thinner near the northwest and southwest edges where natural areas, waterways, and low-density zones dominate.
- Southern Amstelveen achieves exceptionally continuous coverage, indicating mature, evenly spaced stop planning.
Across the four cities:
- Amsterdam’s 500 m coverage ratio (56.8%) is the highest (NYC 56.1%, Singapore 55.9%, Shanghai 55.2%).
- The small city area combined with evenly spaced stops yields high efficiency.
- Singapore also achieves widespread coverage but is constrained by large nature reserves and industrial areas.
- New York is affected by large inter-borough disparities.
- Shanghai’s massive suburban footprint lowers its overall coverage rate.
2.1 500m Network-based Walking Coverage
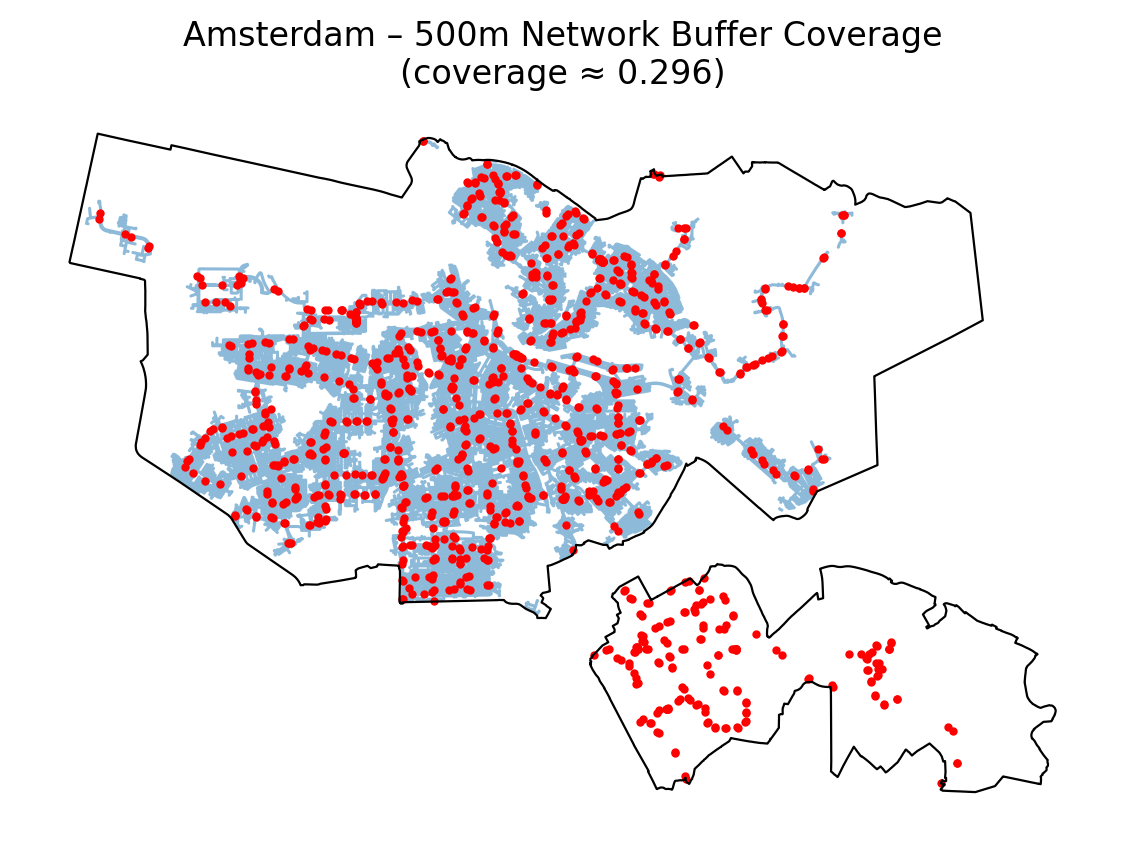
While Euclidean buffers capture theoretical walking distance, the network-based 500 m coverage accounts for how far a person can walk along actual streets and paths.
For Amsterdam, the network-based coverage is approximately 29.6%, which is much lower than the Euclidean estimate of 56.8%.
Why is network coverage lower?
- Amsterdam’s urban form includes extensive waterways, canals, and fragmented street segments, which reduce direct walking routes.
- The city’s historic centre contains narrow alleys, pedestrian-only zones, and discontinuous streets, limiting straight-line access even when stops appear close.
- Peripheral districts include green spaces, industrial land, and fenced-off facilities, creating gaps in the walkable network.
Spatial interpretation
- The central districts still achieve strong coverage, forming a continuous walkable band.
- The southern corridor toward Amstelveen also shows high connectivity, reflecting well-developed, uninterrupted road structures.
- Coverage becomes patchy in Nieuw-West, Noord, and outer districts where street discontinuity is higher.
Comparison with other cities
- Amsterdam’s network-based coverage (29.6%) is:
- higher than Shanghai (15.8%),
- similar to Singapore (34%),
- lower than New York City (43.3%),
which mirrors differences in street permeability and the continuity of walkable links.
Network analysis thus highlights a crucial nuance:
even with very dense stop spacing, a city with fragmented street networks will exhibit much lower “effective pedestrian access.”
3. Kernel density heatmap
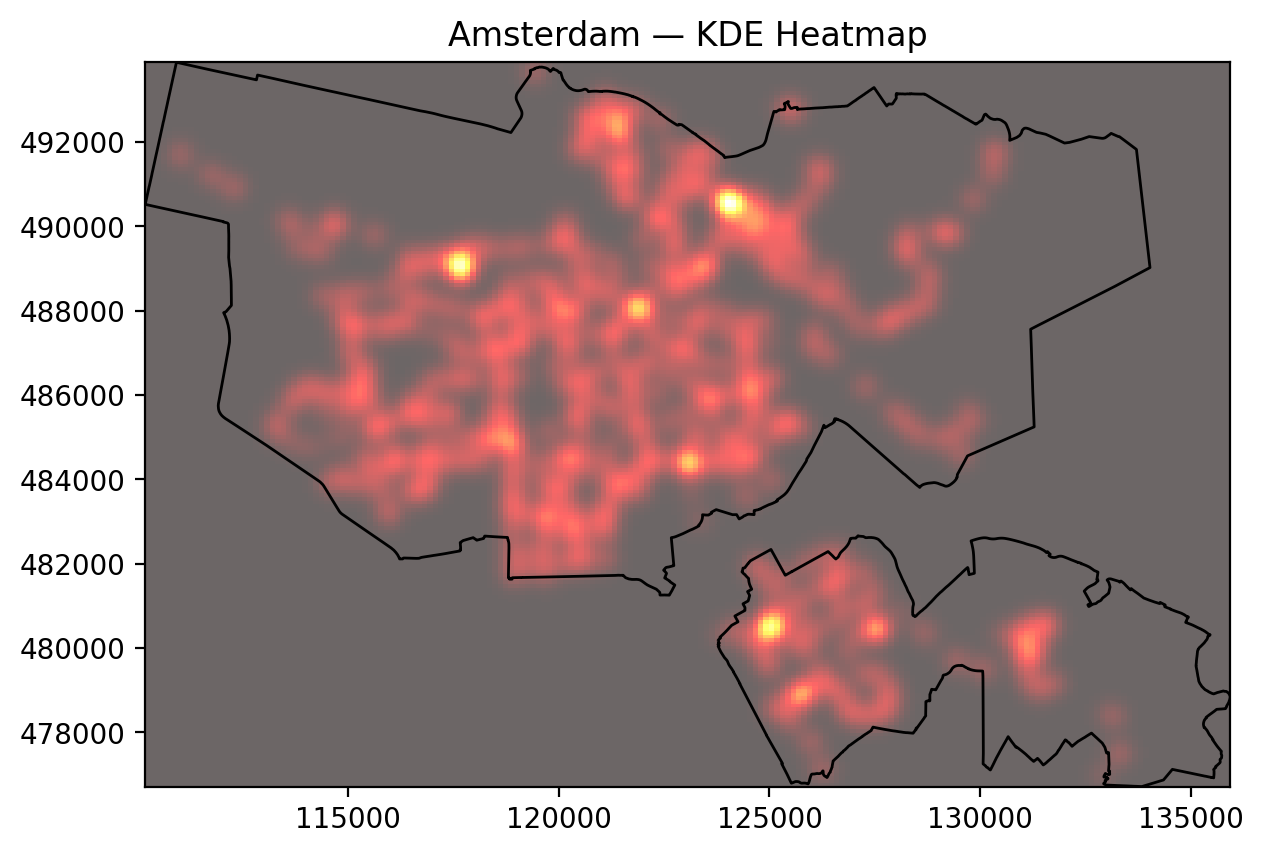
The KDE (Kernel Density Estimation) reveals Amsterdam’s bus stop density structure:
(1) Primary hotspot: Central East–West corridor
- Strongest KDE intensity.
- Overlaps historic commercial and tourism districts.
(2) Secondary hotspots: De Pijp, Oost, western residential districts
- Appear as plate-like distributions, corresponding to well-developed residential grids.
(3) Strong linear hotspot: Amstelveen North–South axis
- KDE shows a bright linear band.
- Reflects the major commuting corridor connecting Amstelveen with the city centre.
Cross-city comparison:
- NYC: density focuses on a single vertical corridor (Manhattan).
- Singapore: wide multi-point density reflecting evenly distributed public housing.
- Amsterdam: hybrid between the two—a compact European multi-nodal system with strong centrality but also secondary clusters.
4. Nearest-neighbour distances
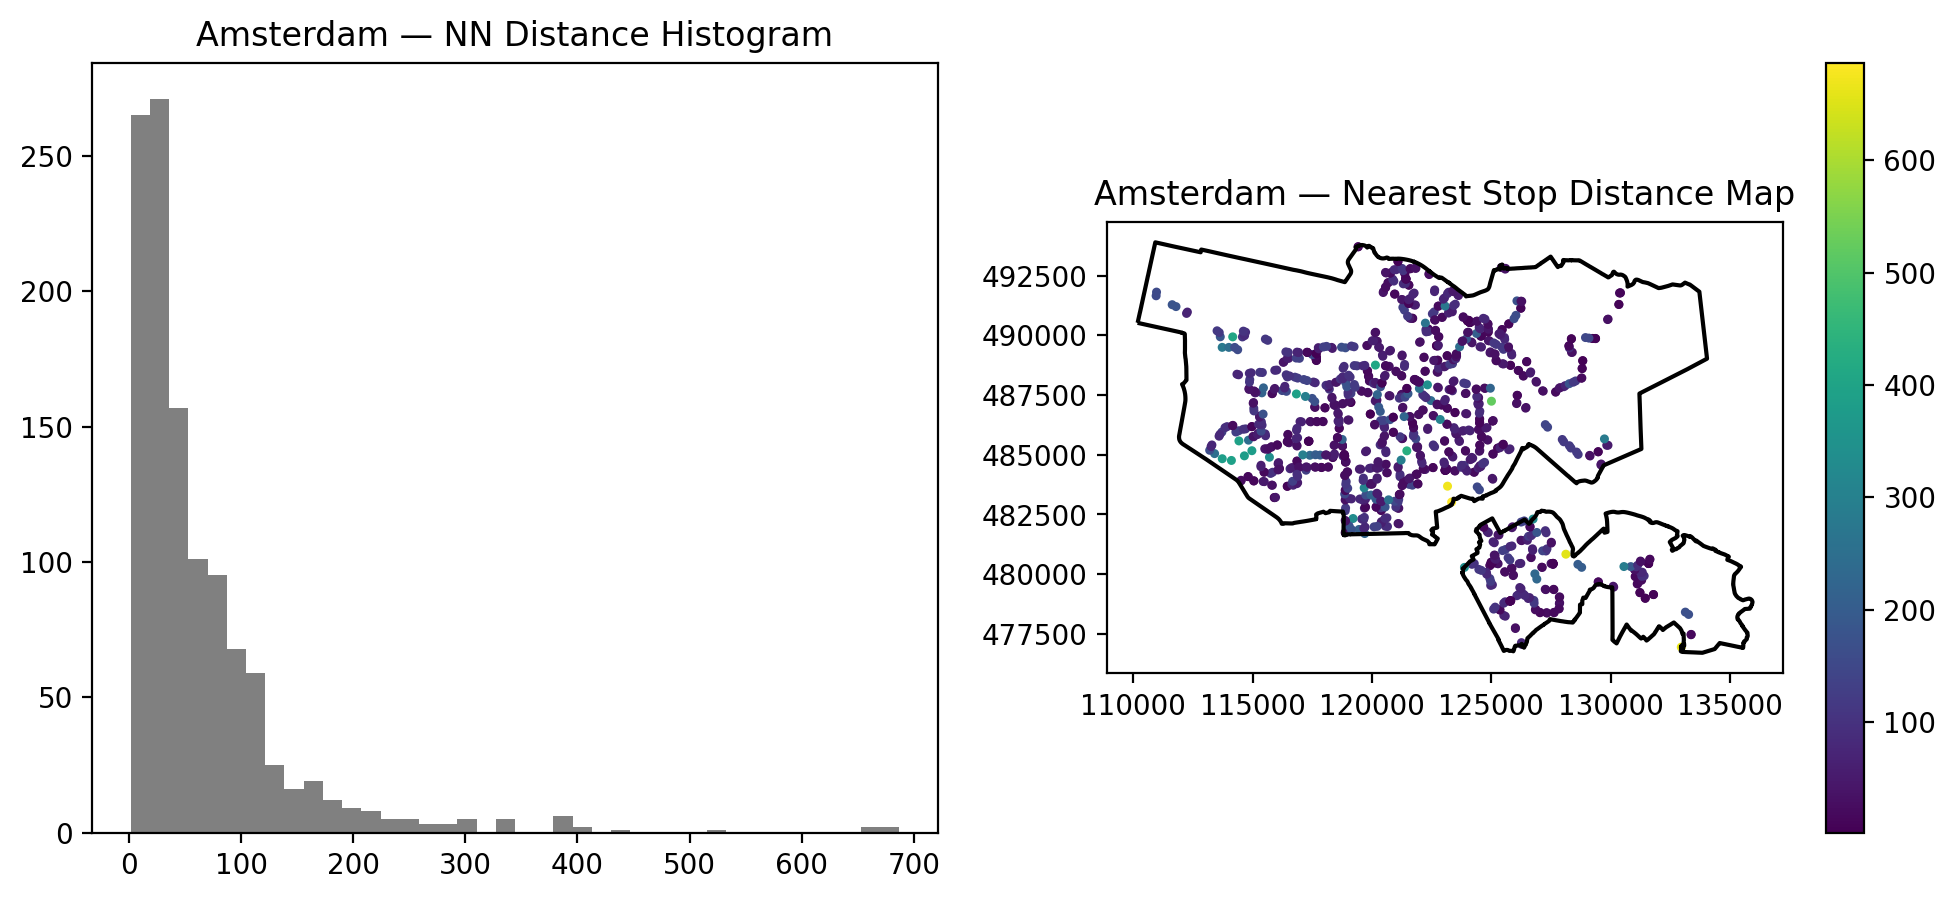
Amsterdam’s NN (nearest neighbour) analysis reveals:
(1) Mean NN = 63 m, the smallest among all four cities
- Amsterdam: 63.3 m
- Singapore: 79.7 m
- Shanghai: 91.3 m
- New York: 183 m
This indicates extremely tight spacing, especially in the core districts.
(2) NN histogram shows minimal long-tail
- Majority of stops lie only 30–70 m apart.
- Very few above 200 m.
- Spatial distribution is nearly “hyper-uniform.”
(3) Larger NN distances cluster at peripheral zones
- These correspond to green areas, industrial zones, and low-density edges.
Cross-city comparison:
- NYC: long tail due to borough differences and uneven stop distribution.
- Singapore: generally uniform but influenced by terrain and constrained areas.
- Amsterdam: most uniform, tightest spacing, reflecting pedestrian-oriented European planning traditions.
5. Amsterdam bus network (GVB reference)
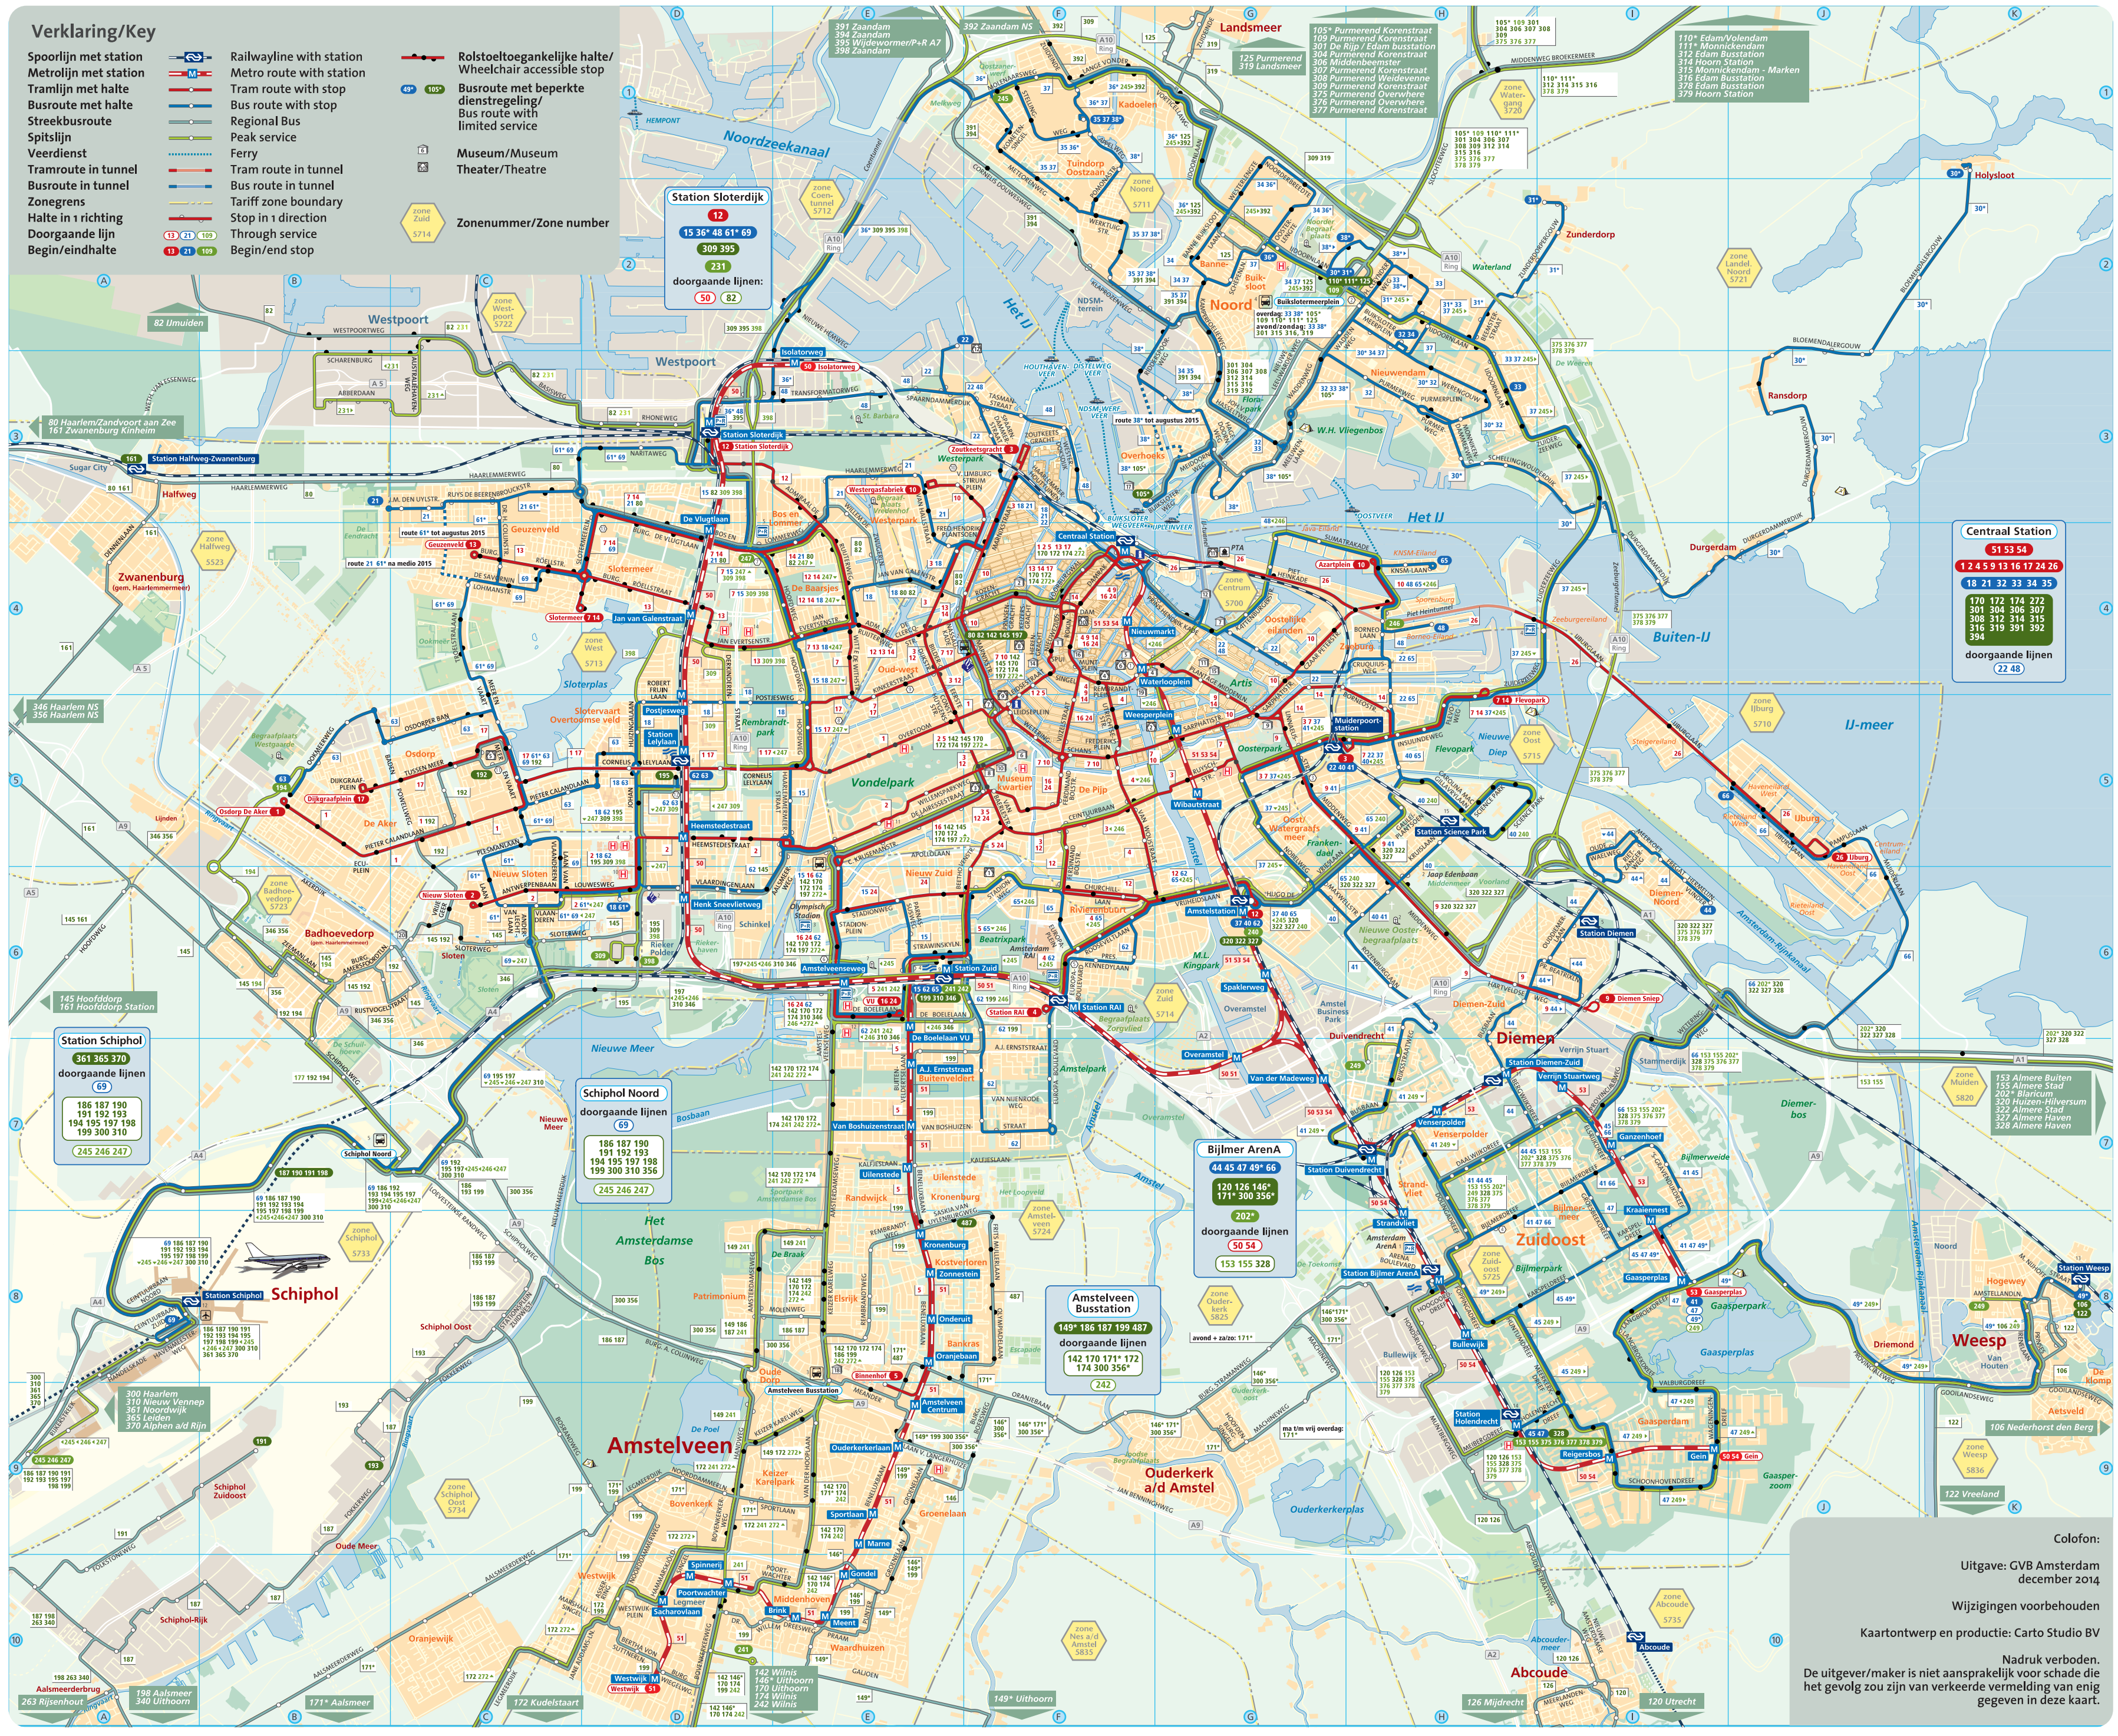
Image source: GVB / Amsterdam public transport – Amsterdam Bus Network Map (via Amsterdam Map 360).
The official Amsterdam bus network map provides functional context not visible in point-based KDE and NN graphs.
(2) Amstelveen–Centrum corridor stands out clearly
- Major north–south trunk routes link Amstelveen directly to the central city.
- Aligns with the strong KDE linear hotspot in the south.
(3) Peripheral areas adopt ring-shaped or semi-ring connections
- North and east edges show fewer routes.
- Corresponds with weaker 500 m coverage and larger NN distances.
- These areas have lower population density or serve industrial and waterfront functions.
How the bus network map complements our spatial metrics:
- KDE/NN show spatial density.
- The lines map reveals functional connectivity.
- Combined, they demonstrate that Amsterdam’s network is:
- Highly dense in the centre
- Multi-nodal
- Peripheral-light
- A compact, European-style transit system
6. Comparative overview (Amsterdam vs. NYC vs. Singapore vs. Shanghai)
| Mean NN distance |
63 m (lowest) |
183 m |
79 m |
91 m |
| 500 m coverage |
56.8% (highest) |
56.1% |
55.9% |
55.2% |
| Stop distribution type |
Multi-core + grid |
Single core + borough gaps |
Territory-wide uniform |
Dense centre + enormous suburbs |
| Urban form |
Compact European |
Large polycentric |
All-island national city |
Mega-metropolitan |
Conclusion:
### Amsterdam achieves the highest bus accessibility efficiency among the four cities
thanks to compact form, uniform stop spacing, and a dense, walkable transit network—distinct from the large-scale structures of NYC and Shanghai and the suburban-nature hybrid form of Singapore.